How to debug dbt errors
How to identify the type of errors and debug dbt easily


If you are a dbt developer, you must have already run into situations where your model could not run due to some errors. The error message returned often gives you a good hint where the problem is to aid your debugging process. However, as a newbie, the whole process of debugging can seem intimidating, and even with very handy guide from dbt Labs on the matter, sometimes a new developer might be completely unaware of additional contexts that might result in errors during dbt development.
This post aims to provide a step-by-step guide to aid your thought process better while debugging in dbt, with those extra contexts. Please note that not all the steps must be covered in all cases, this really depends on the error message you received or how the error is surfaced to you (ideally in your terminal first and not in production).
Prerequisites
Before the deep dive, here are some assumptions that are critical to this debugging process:
You and your team are working in CI/CD workflow.
You are aware of
main/masterbranch and are working on your owndevelopmentbranch when the error(s) pop up.You have understanding of Git and version control.
If any of these sounds unfamiliar to you, please read further here. This is one of the core principles behind developing via dbt. When done right, it helps data team deploy changes faster and reliably, while not compromising on maintainability of the dbt project.
Approach & mindset
Before getting started, let’s get one thing out of the way.
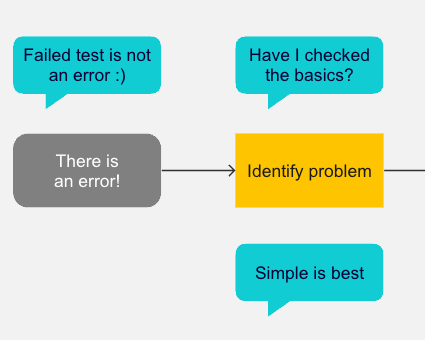
Start with the basics first!
You really want to approach troubleshooting in general with this mindset, not just when working with dbt. Do not overthink and fall down the rabbit hole of complicated solutions. Sometimes, what started the problem can be really simple, like a wrong configuration in your profile.yml or some other minor details in your SQL model.
You would want to first rule out what the possible causes are, and focus on finding simplest solution possible for it. I hope this step-by-step guide would help as a framework for your debugging process.
Last but not least, you got this!
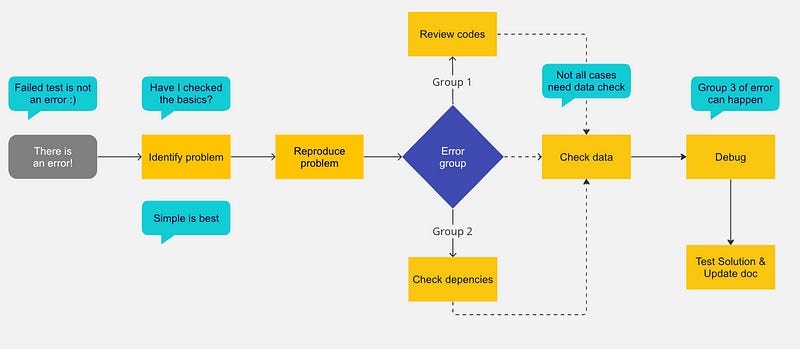
Here is a diagram to aid your thought process. Now let’s dive in.
Step 1: Identify the problem
The first step is to identify the problem. This could be a specific error message, unexpected results, or inconsistencies in your data. It’s important to have a clear understanding of what the issue is before you begin troubleshooting.
Get used to this great doc made by dbtLabs, search for your error. Most of the time, it should fall into one of these categories, the debugging guide would help you clear the problem fast.
Some aiding questions in this process:
Did this model/ piece of code run successfully before?
If yes, what changed? Look for the changes in your IDE. If there is no change made to the model/ tests, this suggests a change in your local environment, or a change in certain settings and configurations. Retrace your step, try to categorize the error group.
❓Groups of errors
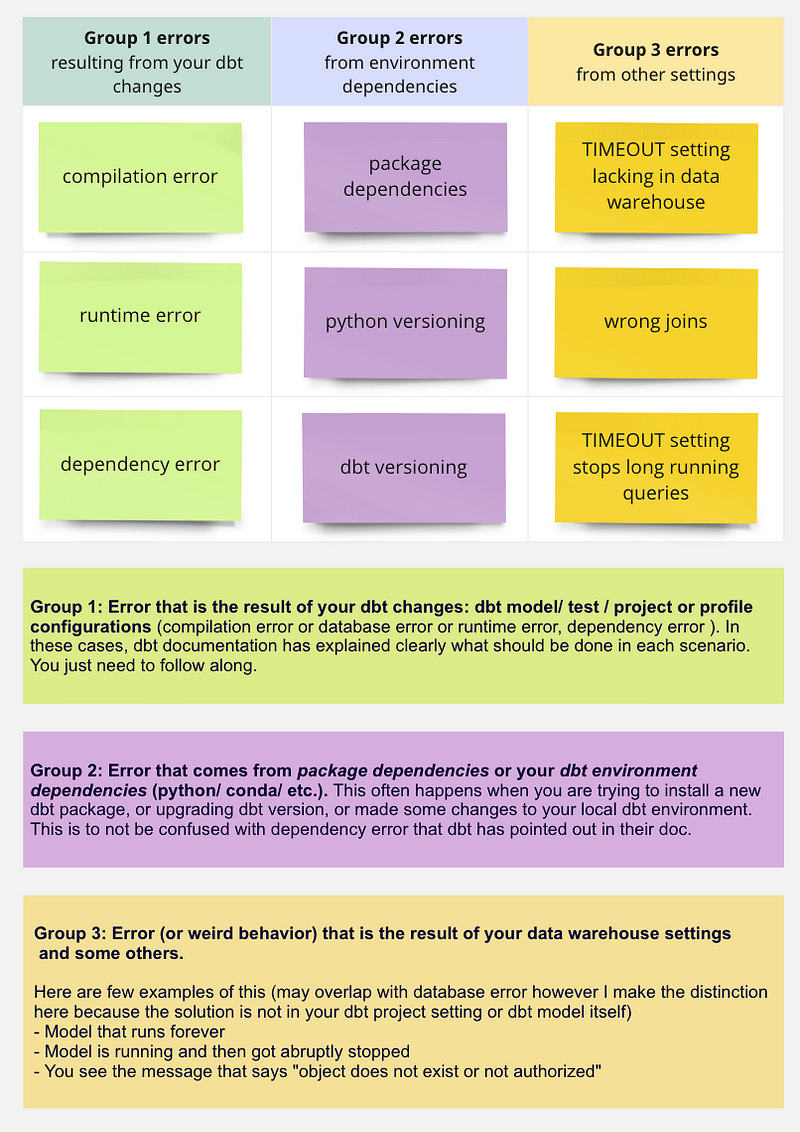
Below are groups of errors that you can run into. This expands on the existing list of errors in dbt documentation, with some change in grouping based on where the error comes from.
⚠️ Test failures are NOT error
It’s tempting when we see a dbt test failed and equate it with error, our reaction maybe to change the severity setting to warn or just remove the test altogether to avoid dbt test failure in the pipeline, to see “green” again.
However, this is not the right approach. Here is why:
Tests should be designed to catch unexpected behavior in the pipeline. This can be of various forms: is a column null when it’s not supposed to be null? is the column containing any value it’s not supposed to have? is the column that is used to join downstream properly returning expected results? etc.
For each of these questions, we have to validate the assumptions that make a model accurate, by writing tests. The test’s expected behavior is to pass when those assumptions are correct, or flag with failure when an assumption is violated — so we can take appropriate actions. The actions here can be: checking data input quality with data input stakeholders, remind them of the right course of action, setting up additional fail-safe to prevent future data input problems, or the action can also be re-evaluating our own assumptions of the data to see if it’s relevant still, and make adjustments to the model and tests where necessary.
Omitting a test does not mean your green pipeline is free from inaccuracies or problems, rather — it’s only undetected.
Hence, test failures should not be considered an “error”. If it does what you expect (which is to highlight a data input issue or to verify a critical assumption on a model to be maintained over time), then the failure is expected to happen. When it does, it means reviewing your data input and call for appropriate actions, not hiding the test away using warn for severity setting (though you may have to resort to this choice if it’s only appropriate left).
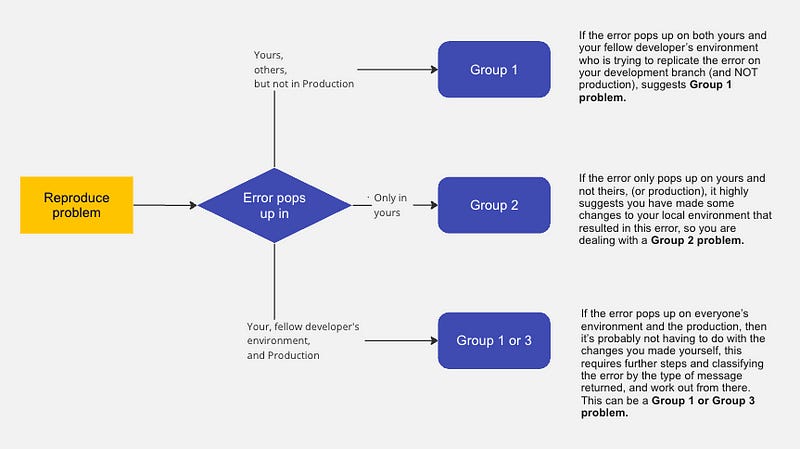
Step 2: Reproduce the issue
Try to reproduce the error (in your existing local environment or a new one). This step is meant to rule out further more potential causes.
This involves running the relevant dbt commands and examining the output to see if you can replicate the issue. If you can’t reproduce the issue, it may be a temporary problem that has already been resolved.
Another helpful approach is to ask for support of a fellow dbt developer on your team, ask them to check out your development branch and try it in their local environment.
Step 3: Review the relevant code
🗒 This is applicable for Group 1 problem
Review the relevant code to understand how it’s supposed to work. This could include examining the dbt models, macros, and SQL queries. Make sure that the code is written correctly and that there are no syntax errors or typos.
Tips:
copy paste the SQL queries generated from dbt compiled file to your data warehouse, errors from syntax and typos will be highlighted at the relevant rows and you can solve them one by one.
if the error has to do with profile config, dbt project config, try to copy paste the example config from dbt website itself into your
ymlfile. That way you reduce the error from wrong spacing and tabbing and linting, along with syntax error in yml.
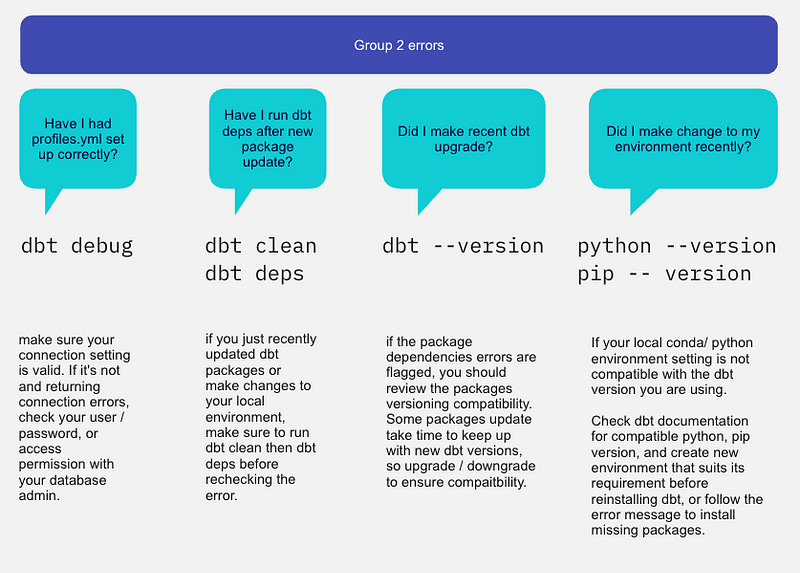
Step 4: Check dependencies
🗒 This is applicable for Group 2 problem
Check the dependencies of the relevant code to ensure that they’re set up correctly. This could include examining the dbt project configuration file and ensuring that all the required packages and plugins are installed.
Here are some considerations for dependencies checks:
Step 5: Check the data
This depends on how the error is surfaced to you.
If it’s failure message from a dbt test result, I have explained earlier how the situation should be handled in Step 1.
If it’s not a failure message from dbt test, rather the result of the dbt model is just defying all what you know about your data. Or sometimes, you can totally miss out on having sufficient tests set up, in which case the error is likely surfaced at end-user level (BI layer) or via users’ feedbacks. All of these scenarios are not in the scope of this post, though I might explore further on this topic another day.
Step 6: Debug
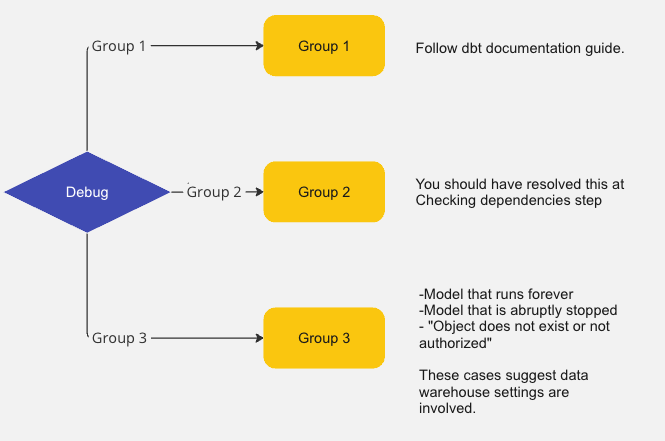
For Group 1 problem, you should definitely check out the handy guide and references here.
Group 2 problem should have been resolved in previous steps. Let’s discuss more on Group 3 problem.
Model that runs forever
This often happens when you wrote a dbt model based on wrong joins, and your data warehouse does not have a TIMEOUT setting in place.
Here is an example:
You have a table called
customer_scd2(1 mil. rows, storing 10K unique customers with their attributes changing over time) and anotherorders_scd2(100 mil. rows, storing 20mil unique orders at different statuses per each)Your analyst wants to create a table that combines customers and orders information, from these 2 tables. However, lacking the understanding of what SCD type 2 table (or similarly, snapshot in dbt) entails, they assumed (wrongly) that the primary key of each table are in turn: customer_id and order_id, and that the
orders_scd2table can be joined to the other viacustomer_idforeign key.The join was made and the model runs for 10, 15, 20 minutes, with no sign of stopping soon. Often the longest run model in your data warehouse is only less than 10 minutes.
What happened was this: When the join was made purely on customer_id, instead of joining the unique records of customers and the orders they each had, the join is actually doing multiplication of row in a way that account for ALL versions of order statuses and ALL changes to customers attributes over time. In this example, it would wrongly process and produces billion rows of records, whereas the correct number should only be 20 millions.
The time it takes to join 2 SCD type2/ snapshots on wrong join assumption is long. And when your data warehouse does not have a TIMEOUT setting, it will run forever (hours!). And so you sit here thinking “something is wrong with my dbt”, but it’s actually because of wrong understanding of your tables leading to wrong join condition, on top of non-TIMEOUT setting.
✅ Solution:
Understand the nature of the tables you are working with is important to avoid this case
Database ADMIN should have TIMEOUT setting in place to stop any query that exceeds the average runtime expected, prevent unwanted financial impact (especially in case of big data sizes).
Model is running and then got abruptly stopped
You may have guessed it, as opposed to previous scenario, in this case the TIMEOUT setting was set and your data warehouse stops the execution of your query.
Another potential reason is if you have Resource monitoring setup (in Snowflake) that works similarly — stopping the virtual warehouse itself from running when the credits reach certain limit.
✅ Solution:
Review your query to optimize where possible
Review TIMEOUT setting and adjust for longer run if it’s appropriate.
You see the message that says “object does not exist or not authorized"
This is often a case of querying on a data table/ view/ schema that you lack permission to query from (if somebody else can still query fine from it), or simply the object has been truly dropped from your warehouse (if everybody else cannot query from it anymore).
In the first scenario, simply ask the Admin to grant you relevant permissions and make sure you are querying using the correct role. In the second scenario, some effort to restore the dropped table is needed.
Step 7: Test potential solutions & update document
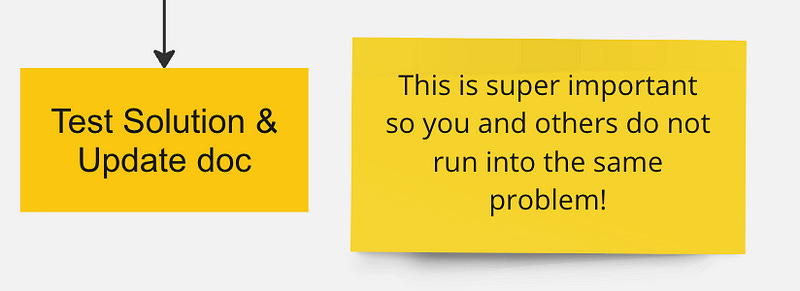
Once you’ve identified the issue, you can start testing potential solutions. This could include modifying the code, changing the data, or adjusting the dependencies. Make sure to test your changes thoroughly to ensure that fixing the issue does not introduce new problems.
Document the solution and update tests
Once you’ve resolved the issue, document the solution. This could include updating the relevant documentation, writing a summary of the issue and the solution in the Merge Request. In most cases, creating a test case to prevent the issue from happening again in the future is necessary.
Summary
That is the end of step-by-step guide on debugging issues you may run into during dbt development. The thought process and contexts that we should ask ourselves or consider during debugging are the main focus of this post, to help the process smoother (and less discouraging). Another important note is when you work with dbt, it’s important to work in recommended CI/CD workflow — which is critical for debugging and having a maintainable pipeline. Happy debugging!