
How to debug Looker query performance
Having the right toolkits to debug is important, knowing where to look is half the process.

Having the right toolkits to debug is important, knowing where to look is half the process. In this post, I will share on how we do this at Joon Solutions.
The problem
Lets say your organization has dozens of Looker developers, and hundreds of dashboards and looks - contents that were originally curated by trained developers to contents that were created by care-free, nonSQL business users.
The problem is when you have to wait for about 5 minutes for a dashboard to load. By that time, marketing has already lost interest in counting to the 120th second, and completed filing a complaint to your Data team about how this is the fifth time in a month they have to sip through their cold coffee waiting for the dashboard to load.
If this sounds vaguely relatable, I will walk you through the framework of how we are solving this at Joon.
First thing first
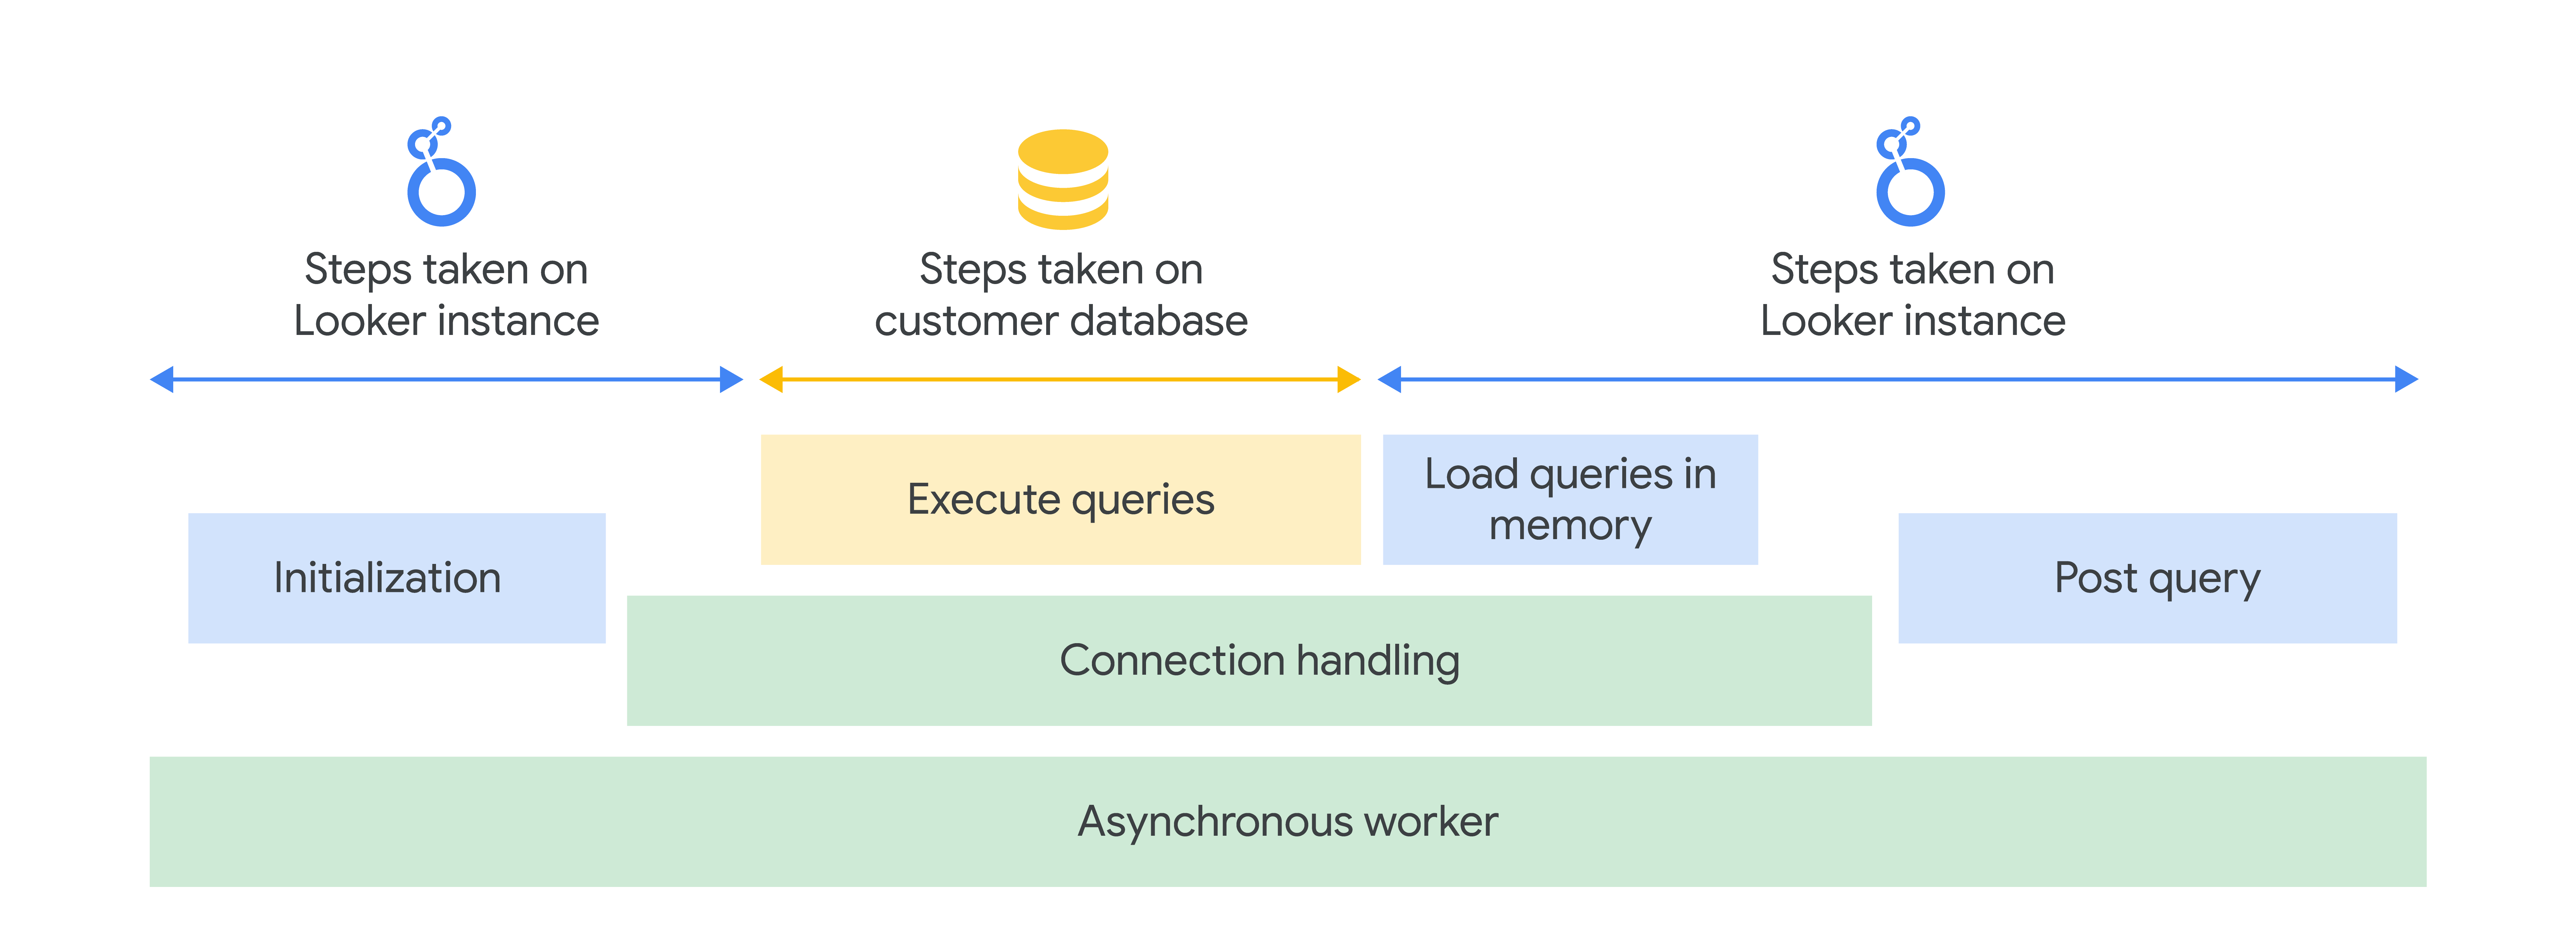
The most foundational thing to establish is that “Looker query speed” is dependent on two things: your Looker instance capacity, and your database capacity. So, this is never just a Looker problem. I’m not saying it can never be a Looker problem, I’m saying we have to factor in the whole process of how a Looker query is generated, then processed at your data warehouse, then returned to Looker memory for post-processing, then render visual results for you.
Knowing this is important because if you assume otherwise, you will look at the wrong place.
So if you gaze deeply into the abyss, you will realize:
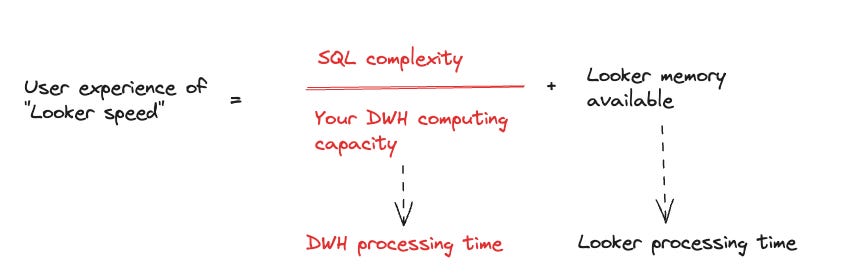
The math may not really math out but the point here is the relationship between these variables stand. Those red texts are your zone of control to improve “Looker speed”. Looker memory is something that you can look further into with Google.
SQL complexity is a general term I’d use to describe: number of computationally intensive operations that your explore manage to produce - things like JOIN, DISTINCT, SORT, PIVOT, or outright SQL anti-patterns that make your data warehouse ponder over its existence.
DWH computing capacity can be understood as whatever term your DWH uses to describe computational power. If you use BigQuery: slot capacity/reservation, Snowflake: Warehouse sizes, etc.
DWH processing time is reduced if your DWH computing capacity increases, and the more complex your SQL query is, the more time it takes for your DWH to process - so you will see the relationships denoted by SQL complexity divided over DWH computing capacity.
What tools are available?
Not to reinvent any wheel, you can use right away some ready made System Activity dashboards available in Looker Admin:
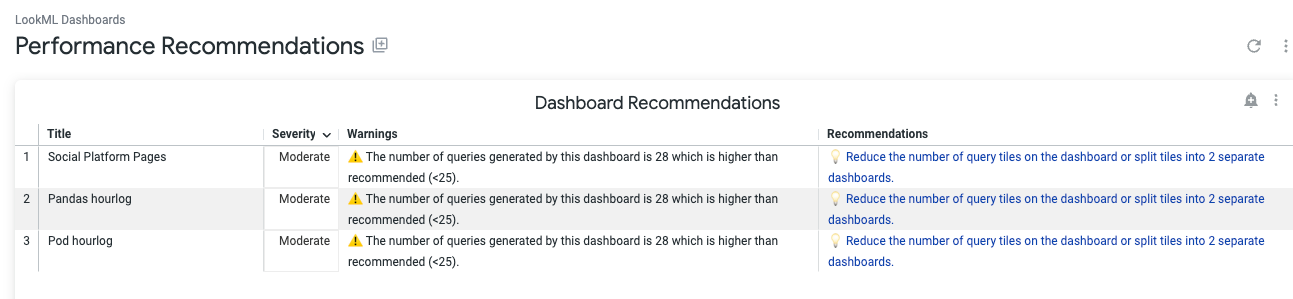
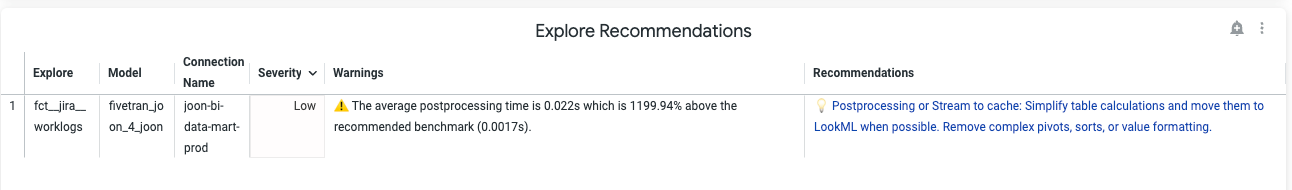
Performance Recommendation
This one gives you a summary of what went wrong with each Dashboard, and each explore, and what the Looker recommendations are for each case.
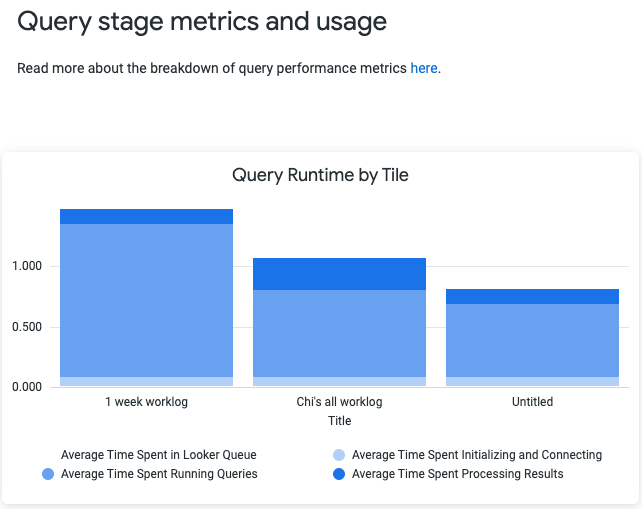
Dashboard Diagnostics
There is also the recent feature Dashboard Diagnostics - which gives you something like this - a breakdown of query runtime by Tile (visual chart) you have in a single dashboard.
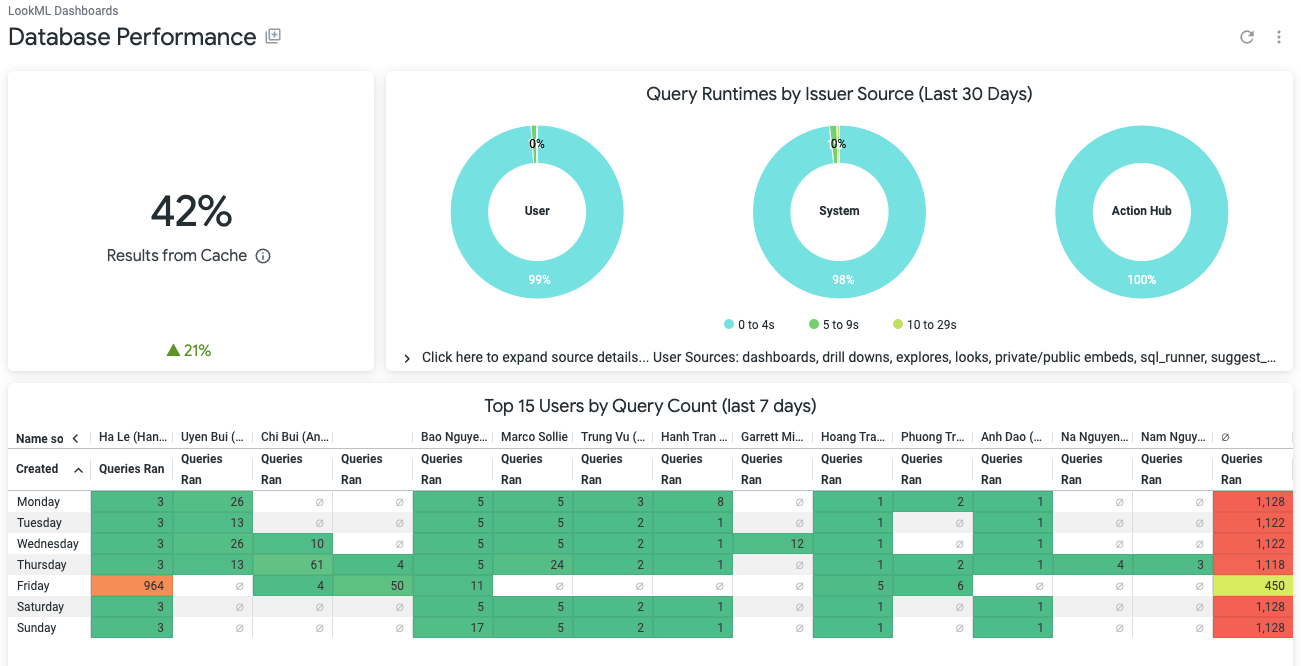
Database Performance
This is handy when you want to know cache percentage, query runtime bins, and who has been the most active culprit in stressing out your database.
There are more and you can refer to Looker documentation to understand what each of this dashboard help you see.
Bringing it together
Each of these give you a part of the picture, but not everything. It’s important to know where to look, and this is often the most frustrating part of the process: having all the information in one place to produce a diagnostics, and help you focus on the right “issue” to solve.
It’s important to know that not every metric indicates a real problem. For instance:
What does 42% cache result mean? Is it a problem?
Are all the benchmark exceeding Looker’s threshold a problem?
What do all these even mean? Is this a computation problem in the database (not being able to handle all the workloads?) Is this a Looker memory instance problem (if so should I upgrade my memory)? Is this a “dashboard too many tiles” problem (should I start splitting the dashboard tiles and prevent UDD dashboards)?
You can easily be overwhelmed with all the metrics that come your way, and while each gives you a part of the elephant, you cannot seem to comprehend the elephant.
This brings me to the next part: How to make sense of it all. It’s important to have a process and framework of discovery to avoid the wrong path in the jungle.
How to navigate?
So a few things I have tried in the past are:
Bringing all the i__looker dashboards into one place and only takes the crucial information out, consolidate things I often need, into a single dashboard.
Using Looker performance metrics to narrow down the culprit behind slow queries.
Using python scripts that our team develop to figure out all the explores constructed in Looker project, to detect anti-patterns and identify places to optimize.
All-in-one performance metrics report
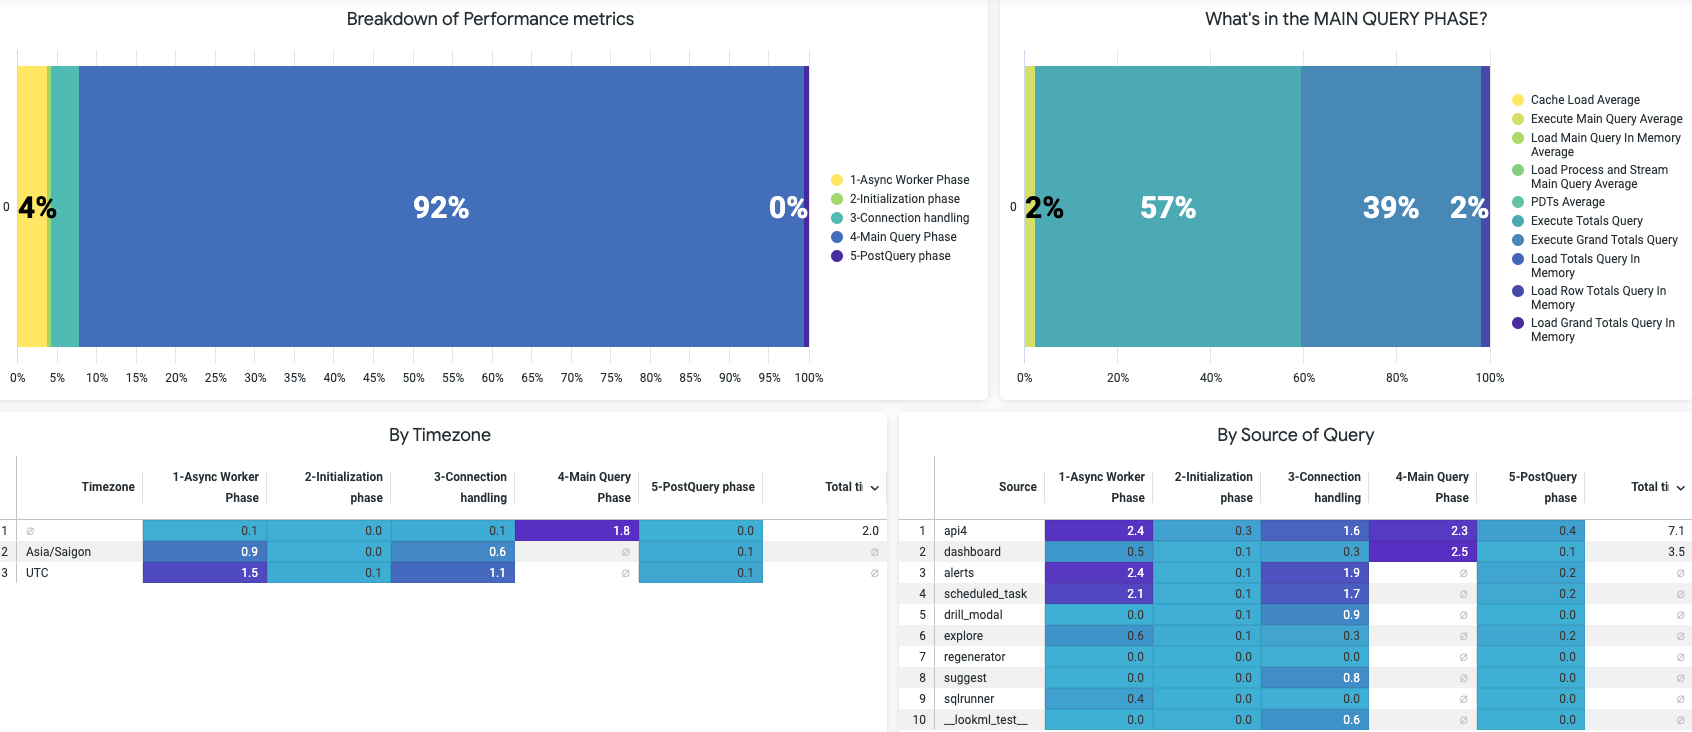
What this gives you:
It breaks down the whole Looker performance metrics from initial stage to post-processing, and tell you which stage takes the longest.
Once you know which stage takes the longest, you have the answer to “Is this in my zone of control at all?” (hint: if it’s Main Query Phase: then yes)
The dashboard then looks at many other aspects of the elephant:
is there a particular timing that this slowness occurs? (if you are on multi-timezone operations, this is important to consider and plan your warehouse zone/region too)
is there a particular source of query that is slower than others? (if it’s just the alerts/ dashboards, chance are simply removing some tiles/alerts or optimizing them already solves your problem, if it’s the “explore” then I have bad news: you will need to investigate your explore anti-patterns - which can range from mild LookML refactoring to heavy-duty scorch-earth model refactoring in your data warehouses)
any particular explore that takes longer time to process? (this is when you have come to final stage of grief and decides to look for particular culprit to address).
Knowing when to use which solution
Remember this?

If you have determined that DWH computing capacity is to blame, it’s quite easy to test this out: you simply resize the data warehouse to accommodate query workloads from your Looker. You can read more into ways of fixing in Snowflake here.
If you have come to terms with the sad reality of SQL complexity is to blame:
Use the recommendations from Looker System activity reports should give you very clear next steps. Follow them.
The harder challenge is when you realize you have done the above but explore is still slow to query - this is when refactoring is needed. Things like: considering partitioning, re-clustering, materializing into TABLE instead of VIEW, denormalizing an explore into fewer tables, etc. Each of these approach comes with pros and cons and require thorough testing to choose from, as no explore is the same.
To conclude
Debugging Looker performance can be a complicated, frustrating process. However if you have a map to navigate the road, it should be easier. I hope the few pointers above help in case you run into similar problems. There are more details to be covered, which are not yet discussed here:
Categorizing problems
Testing solutions approach: from least-time to more-time consuming
Python toolkit
…which I will cover on other blog posts.